|
|
|
|
|
POSTERS |
||
|
|
||
|
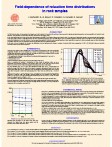
Field-dependence of relaxation time distributions in rock samples |
||
|
|
||
|
|
||
|
|
||
|
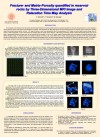
Magnetic
Resonance Imaging Visualization of Air – Water Displacement |
||
|
Improved pore space structure characterization by fusion of relaxation
tomography maps |
||
|
|
||
|
|
||
|
click on the image to download the poster (823KB)
|
||
|
|
|
|
|
|
||
|
|
||
|
1H-NMR relaxation times of water-saturated rock samples are widely employed to characterize the architecture of pore space and to estimate petrophysical properties, such as permeability and irreducible water saturation. These parameters are used both in laboratory studies and in well logging (NML).
So far, such NMR studies were always carried out at a fixed frequency
(typically 10 or 20 MHz in laboratory and 2 MHz in NML). It is well
known that NMR relaxation rates are inherently field-dependent, a
fact which might represent a complicating factor in the above mentioned
applications. Mono-exponential analyses of so far published longitudinal
relaxation dispersion profiles of rocks indicates that a modest
field dependence in fact exists. However, it has been amply demonstrated that the mono-exponential hypothesis is rarely applicable to
natural rocks, where one usually observes a wide distributions of
relaxation rates, due to the wide distributions of pore sizes and their
physical and chemical properties.
In this study, we have investigated
the relaxation rate distributions in several sandstones and
carbonates at a number of relaxation field values, ranging from 10 kHz
to 30 MHz (field values are henceforth expressed in terms of proton
Larmor frequency).
click on the image to download the poster (640KB)
|
||
|
|
|
|
|
|
||
|
|
||
|
click on the image to download the
poster (970KB)
|
||
|
|
|
|
|
|
||
|
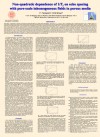
Fracture- and Matrix-Porosity quantified in reservoir rocks |
||
|
The
contribution of the fractures to the total porosity and their spatial
distribution in fractured oilfield reservoirs are essential parameters
for production forecasting and for
a correct modeling of stored hydrocarbon volume,
fluid dynamics and matrix/fracture exchange. Three-dimensional (3D) MRI
image analysis has been recently proposed as a particularly useful
non-destructive method to visualize and quantify fracture network1 and
flow2.
A 3D image of fractures is much more representative than the
corresponding set of 2D images, as fracture spatial continuity through
many 2D sections is better recognizable, as well as their location and
orientation within the sample volume. Moreover
1H-MR
Imaging is particularly suitable to detect interconnected porosity since
only the
water in interconnected fractures and open matrix can be visualized
after full saturation. In this work 3D surface images of fractured
oilfield rocks were obtained and analyzed starting from many different
MR planar images.
On fractured
reservoir rock samples we followed a procedure to get in many different
way 3D images showing separately the fractures and the matrix porosity.
Matrix-porosity and fracture-porosity, as well as the shapes and the
interconnectivity between fractures and their anisotropic behaviour were
determined. Following the described procedure, it is possible, in a few
seconds, starting from several two-dimensional images, to obtain
three-dimensional images that can be measured in order to find out the
structural parameters which is the object of study.
click on the image to download the
poster (3.8Mb) |
||
|
|
|
|
|
|
||
|
with pore-scale inhomogeneous fields in porous media
|
||
|
When CPMG T2 measurements
are made for a liquid sample with unrestricted diffusion in a constant
magnetic field gradient g, the increase R in 1/T2 is
⅓(τγg)2D,
where γ is magnetogyric ratio, τ is half the echo spacing TE, and D
is diffusion constant. For
measurements on samples of porous media with pore fluids and without
externally applied gradients there may still be significant pore-scale
local inhomogeneous fields due to susceptibility differences, whose
contributions to R depend on τ.
Here, diffusion is not unrestricted nor is the field gradient
constant. One class of
approaches to this problem is to use an “effective” gradient or some
kind of average gradient. Then,
R is often plotted against τ2,
with the effective gradient determined from the slope of some of the
early points. In many of these
cases a replot of R against τ instead of τ2 shows
a substantial straight-line interval, often including the earliest
points. Of course R
approaches an asymptote at sufficiently long times, where diffusion is
sufficient that the refocusing of echoes becomes ineffective, in which
case an arctangent fit may give both the initial linear behavior and
the asymptotic behavior. If
data can be taken at sufficiently short τ values, a short interval of
τ2 dependence
may be found, but it is often very short.
In earlier work these features were noted, and attention was
called to the fact that very large changes in field or gradient are
likely for a small part of the pore fluid over distances very much
smaller than pore dimensions.
It was also noted that, over a range of about forty of the parameter ξ
= ⅓χνa2/D,
where χ is the susceptibility difference between pore solid and fluid
and ν is the frequency, R does not depend much on pore size
a or on diffusion constant D.
This was found to be compatible with the assumption of a
long-tailed distribution of local fields, such as a truncated Cauchy-Lorentz
distribution, which has very different averaging properties for
relocation under diffusion than does the Gaussian.
This behavior is seen most simply in porous media without wide
distributions of pore sizes and consequent wide ranges of ξ and
natural T2.
Examples are shown where plots of R2 vs
τ show better linear fits to the data for small τ values than do plots
vs τ2.
If both grain-scale and sample-scale gradients are present, it
may be possible to identify the separate effects with the linear and
quadratic coefficients in a second-order polynomial fit to the early
data points.
click on the image to download the
poster (180KB) |
||
|
|
|
|
|
|
||
|
A dedicated NMR apparatus for non-invasive and
non-destructive
|
||
|
Nuclear
Magnetic Resonance Relaxometry is a universally accepted technique for
the determination of structural and transport properties of porous
media in a non-destructive and non-invasive way. In particular, it
allows one to determine1 porosity,
permeability and irreducible water saturation. The increasing use of
this methodology requires new types of equipment making it possible to
investigate samples with particular characteristics, such as large,
full-size cores. In order to perform relaxation measurements on full
size cores, an apparatus has been designed and built. It is composed
of a versatile SPINMASTER console, a permanent magnet with large bore
and good field homogeneity over the whole sample volume, and several
RF coils combining large volume with short dead time with high B1 field
homogeneity. The apparatus is compatible with the cores of up to 12 cm
in diameter. To further improve the performance of the apparatus, we
have implemented special measurement pulse sequences, such as
Logarithmically distributed Aperiodic Pulse Saturation Recovery
(LAPSR) and Inversion Recovery with Composite Inversion Pulse (IR-CP)
and CPMG with Composite Inversion Pulses (CPMG-CP).
click on the image to download the poster (2.8Mb)
|
||
|
|
|
|
|
|
||
|
|
||
|
In the last
fifteen years, techniques based on Nuclear Magnetic Resonance (NMR)
have become commonly used for the study of porous materials in a
non-destructive and non-invasive way (1). Magnetic Resonance Imaging (MRI)
(2,3) gives us a unique way for studying and understanding multiphase
fluid flow and displacement in rocks. The method makes it possible, by
repeated measurements on the same sample over time, to follow the
evolution of the phenomena being studied. Usually, the saturating
fluid is water and the signal from
1H
nuclei is detected, but other fluids, such as hydrocarbons, and nuclei
other than
1H,
such as
3He,
129Xe
and SF6,
can be imaged. The original idea was that NMR could see the hydrogen
in both oil and water in the pores of porous rocks, and the first
generation of Nuclear Magnetism Log tools was developed (4). Nowadays
an ever-growing number of NMR applications are used by oil industry in
order to evaluate reservoir properties and to assess formation
producibility (5). Understanding the influence of the pore space
structure and of the surface properties on the fluid flow inside is a
central item in designing processes such as soil remediation and oil
recovery. One of the most important themes in petroleum engineering is
the
modeling
of fluid flow and flooding in such complex porous systems as rocks.
MRI can give an important contribution to understand these phenomena.
Examples of the MRI ability to give information both on the
distribution of fluids in multiphase flow and on their temporal
development are given by Chen et al. (6).
In this paper a
systematic set of drainage and imbibition experiments, in order to
determine the sensitivity and accuracy of the method, are shown:
phantoms and natural rocks with increasing heterogeneity were used.
Samples fully saturated with one fluid phase, after being confined in
a sleeve to seal the edges, were placed in the sample gap of the MRI
tomograph and subjected to displacement by the other phase. The images
were acquired at different intervals of time after periods of flooding
following the kinetics of the interface between the phases.
click on the image to download the poster (170KB)
|
||
|
|
|
|
|
|
||