|
|
 |

 |
|
Cultural Heritage |
|
Relaxation
time distributions before and after
hydrophobic treatment
|
|
Magnetic Resonance Imaging
applications
|
|
POSTERS |
|
|
|
Relaxation
time distributions before and after
hydrophobic treatment
Research
in collaboration with L. Appolonia, Safeguarding Cultural Heritage
Department, Aosta, and G. Rezzaro, CNR Laboratory, Safeguarding Cultural
Heritage Department, Aosta, Italy.
[Magn. Reson. Imaging
19, 2001, 509-512]
|
|
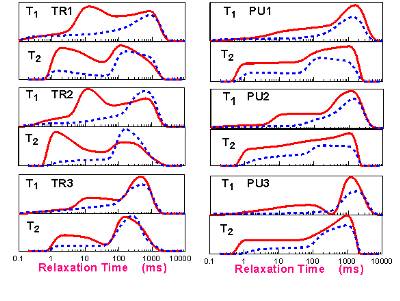
T1 and T2 relaxation time distributions for three
Travertine and Three Pudding stone samples, fully saturated with water,
are shown before treatment (solid line) and after treatment (dashed line).
There is much variation among the three samples of either type of
rock, but
also there are some general differences between the two types. The
features of relaxation time distributions correlate with known physical
features of the samples and give information on classes of pores from which water is excluded by the
hydrophobic treatment.
|
|
|
|

|
|
Magnetic Resonance Imaging
applications
Research
in collaboration with Mara Camaiti CNR-ICVBC, Sesto Fiorentino (FI)
[La Chimica e l'Industria 81, 1999, 729-731; J. Cultural Heritage 1,
2001, 127-132;
Giornale delle Prove non distruttive Monitoraggio Diagnostica XXIII (3),
2002, 34-40;
Giornale delle Prove non distruttive Monitoraggio Diagnostica XXIV (4),
2003, 69-72;
Atti II Congr. Naz. AIAR pagg 133-148, Patron Editore, 2002
Addison Wesley pagg 241-261, 2003; Studies in Conservation 48, 2003, 1-6]
|
|
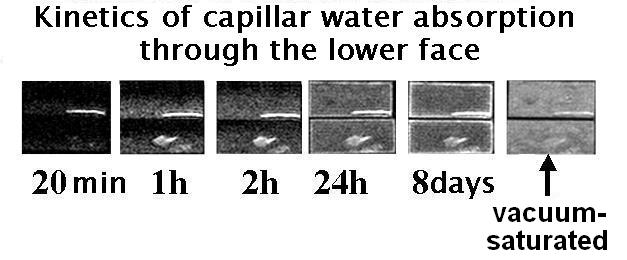
The
structure of a porous stone saturated with water can be directly
visualized by MRI. As a first approach, simple images of adjacent internal
sections can be acquired, where the signal is roughly proportional to the
density of 1H nuclei. As for medical diagnosis, where images of
internal sections of the human body are obtained, also in this case the
acquisition is clearly non destructive and gives an unique way to see
inside the rock.
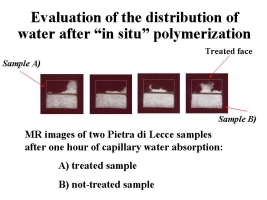
MR images of one section
each of two samples of Lecce Stone after fixed times
of capillary water absorption
show the non-homogeneity of the stone
that is due
to the presence of shells.
|
|
 |
|
|
|
|
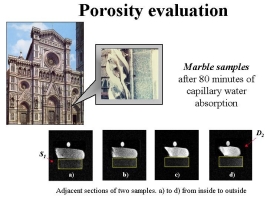
With this method the local porosity of internal sections can be evaluated.
An example is given of two decayed marble samples
from the Cathedral of Santa Maria del Fiore in Florence. The figure shows
four adjacent sections of the two samples after 80 minutes of capillary
water absorption. The heavily decayed sample (D2) shows higher
signal intensities than the slightly decayed sample (S1). The
signal intensity is not uniform and
shows the non
homogeneous porosity of the stone. The analysis allows us to compute the
amount of pore space filled by liquid water. The data obtained after 8
days of water absorption are in good agreement with the known total
porosity of
the samples. The inner parts of the samples show lower porosities
than the outer parts.
|
|
 |
|
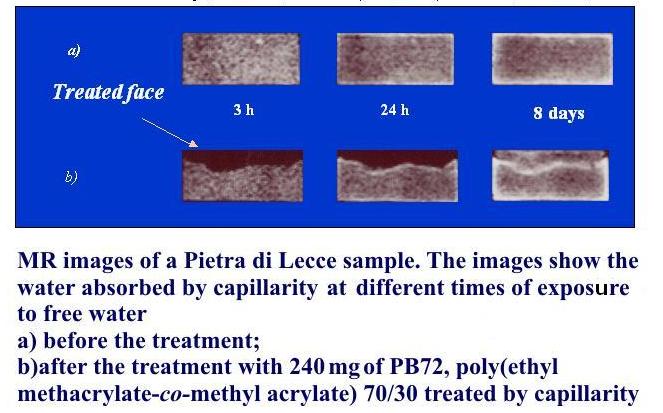
MRI also
provides direct evidence
of protective performance. It gives images of the spatial distribution of
liquid water, providing new insight into the study of hydrophobic
treatments, getting indirect information on the distribution of the
hydrophobic product. As an example, the figure
shows a proton density image of an internal section of a Lecce Stone (parallelepiped 5x5x2cm3) before (top) and
after (bottom) treatment. A distribution profile of the product is
clearly evident. It is visualized by the inhomogeneous distribution of
water after 24 hours of capillary water absorption from the untreated face
of the sample. After 8 days of absorption the distribution profile is
still visible, although water is now present in all the regions of the
sample. It is interesting to note that a result of that study was
evidence of a notable decrease in the hydrophobic efficacy after
wetting-drying cycles, attributed to a loss of adhesion of the polymer to
the substrate, promoted by the action of water.
[Magn. Reson. Imaging 19, 2001, 513-516]
|
|
 |
The
efficiency of polymerization in situ can also be analyzed.
|
|
 |
| |
| |
|
|